matplotlibでヒストグラム
matplotlibでヒストグラムを書く。
Definition:
hist(x,                      #データ。yなし。
    bins=None,               #bin(棒)の数。省略すると10
    range=None,              #binの表示範囲をタプルで。
    normed=False,            #Trueとすると正規化(合計値を1とする)
    weights=None,            #
    cumulative=False,        #True:累積ヒストグラムになる。
    bottom=None,             #棒の下側の余白を指定
    histtype='bar',          #'bar':ヒストグラム 'barstacked':積み上げ, 'step':枠線のみ, 'stepfilled': 枠線+塗り
    align='mid',             #棒の中心をx軸目盛のどこに合わせるか。 'left', 'mid', 'right'
    orientation='vertical',  #'vertical':縦棒 'horizontal':横棒
    rwidth=None,             #棒の幅指定。数値または配列で指定。
    log=False,               #True:縦軸を対数目盛りにする
    color=None,              #棒の色。配列で指定。
    label=None,              #ラベル
    stacked=False,           #True:積み上げヒストグラム
    hold=None,               #
    data=None,               #
    **kwargs)                #
・累積ヒストグラム:1シリーズのデータを累積表示。右上がりになる。
・積み上げ表示 :複数のヒストグラムを積み上げる。
指定はhisttype="barstacked"でもstacked="True"でも。
○基本
import numpy as np
import matplotlib.pyplot as plt

x = np.random.normal(50, 10, 10000)  #平均50、標準偏差10、データ数10000
plt.hist(x)                          #ヒストグラム化(メモリ内で)
plt.show()                           #グラフを表示

プログラム終了時に自動的にグラフ表示されるので、出力するグラフが1つだけのときはplt.show()不要。
デフォルトでは棒は10本。
○棒の数を指定
plt.hist(x, bins=20)

○横軸の表示範囲の指定
plt.hist(x, bins=20, range=(0, 50))

○正規化
plt.hist(x, bins=20, normed=True)

○累積ヒストグラム
plt.hist(x, bins=30, normed=True, cumulative=True)
正規化した累積ヒストグラムは値が1に近づく。

○塗りつぶしなしの枠線で描く
plt.hist(x, bins=20, histtype="step")

○横向きの棒で表示
plt.hist(x, bins=20, orientation='horizontal')

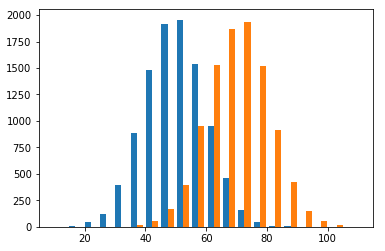
○複数系列のデータの表示
x1 = np.random.normal(50, 10, 10000)
x2 = np.random.normal(70, 10, 10000)
plt.hist((x1, x2),  bins=20)

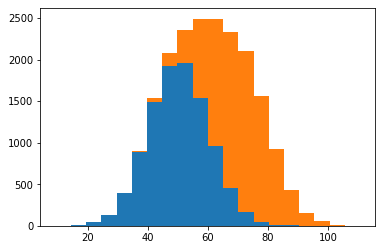
○積み上げ表示
x1 = np.random.normal(50, 10, 10000)
x2 = np.random.normal(70, 10, 10000)
plt.hist((x1, x2),  bins=20, stacked=True)

積み上げ指定はhisttype="barstacked"でもstacked="True"でも。
凡例、軸設定などのグラフ全般はmatplotlibで折れ線グラフの記事で。
参考:
Python でデータサイエンス